If a map has a pre-loaded route, you can display the heatmapped elevation data along this route. To do this, click the mountain-shaped button in the top right of the screen.
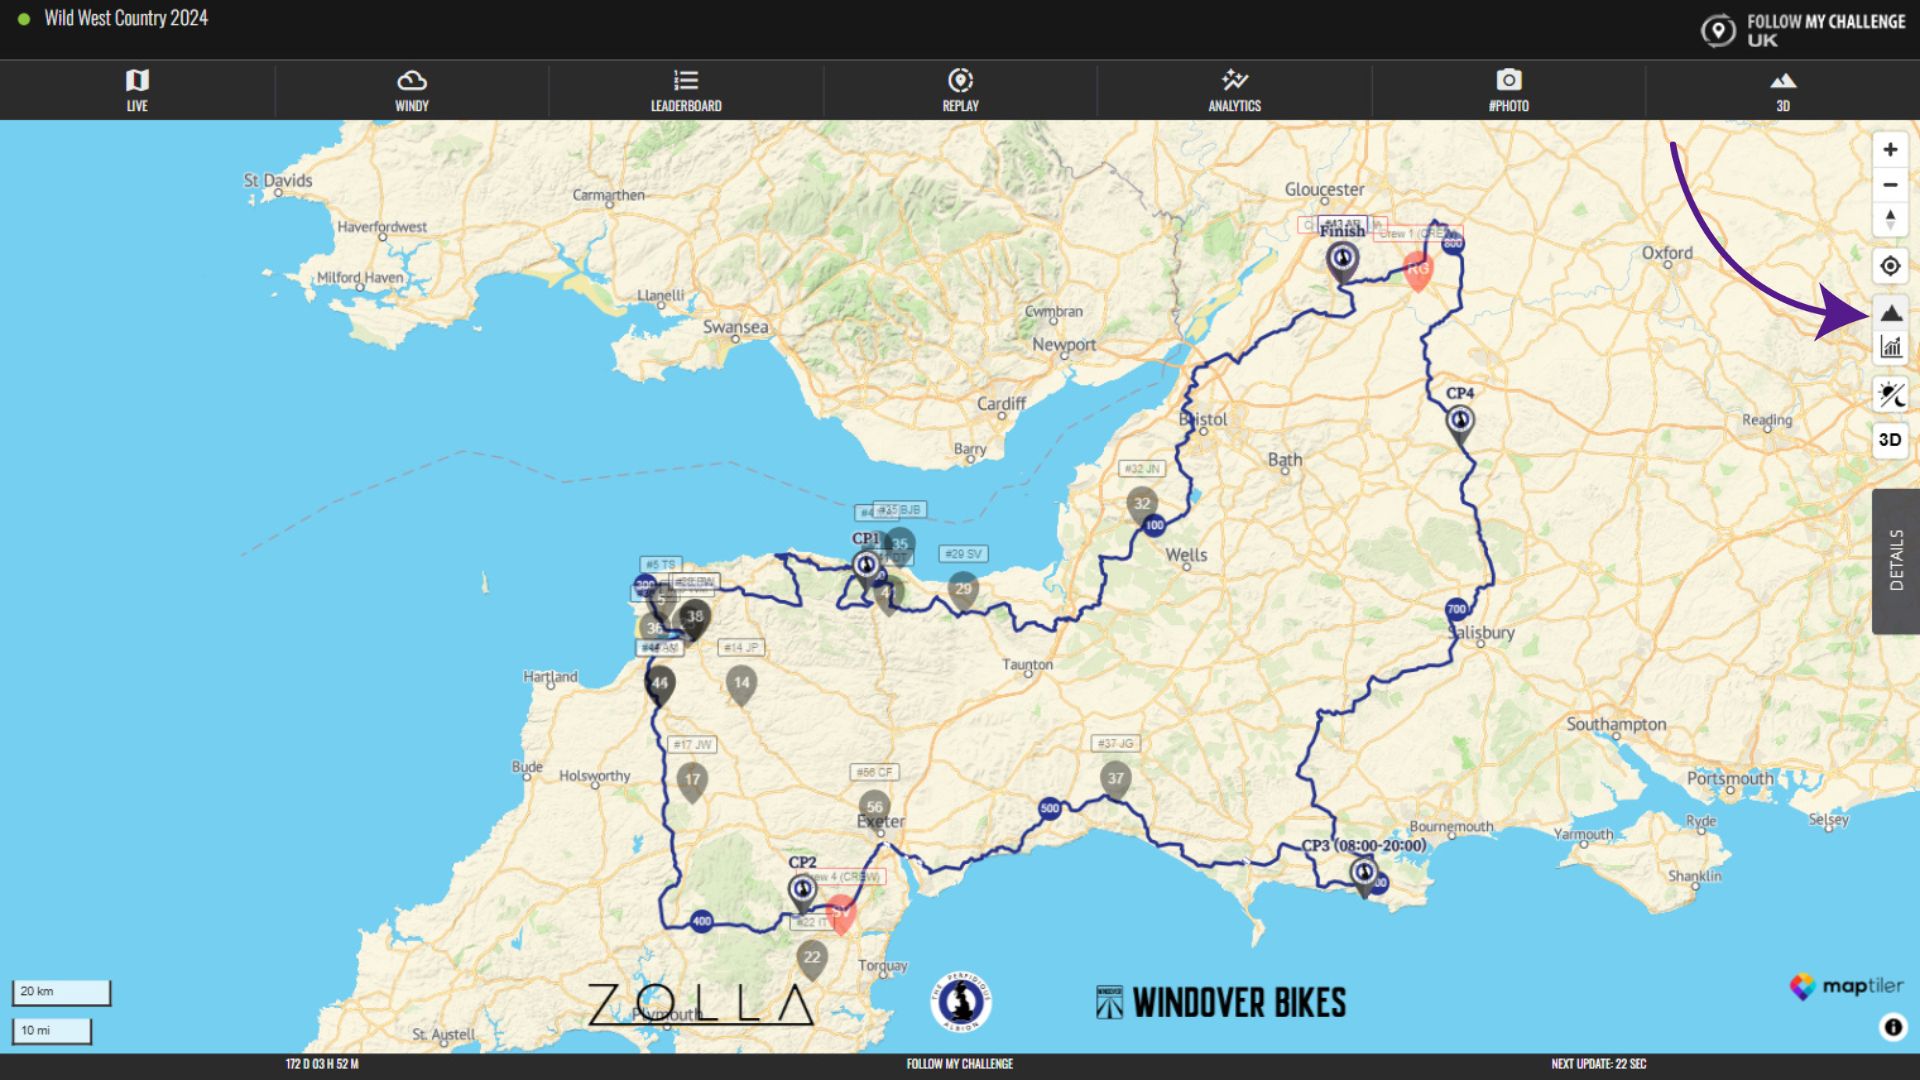
Once clicked, this will show the elevation data overlayed on the route. Green indicates lower elevation, while red indicates higher elevation. This is displayed relative to that particular route, so it will adjust between maps.
If you click the button again, it will display a 3D visualisation of the elevation changes along the route.