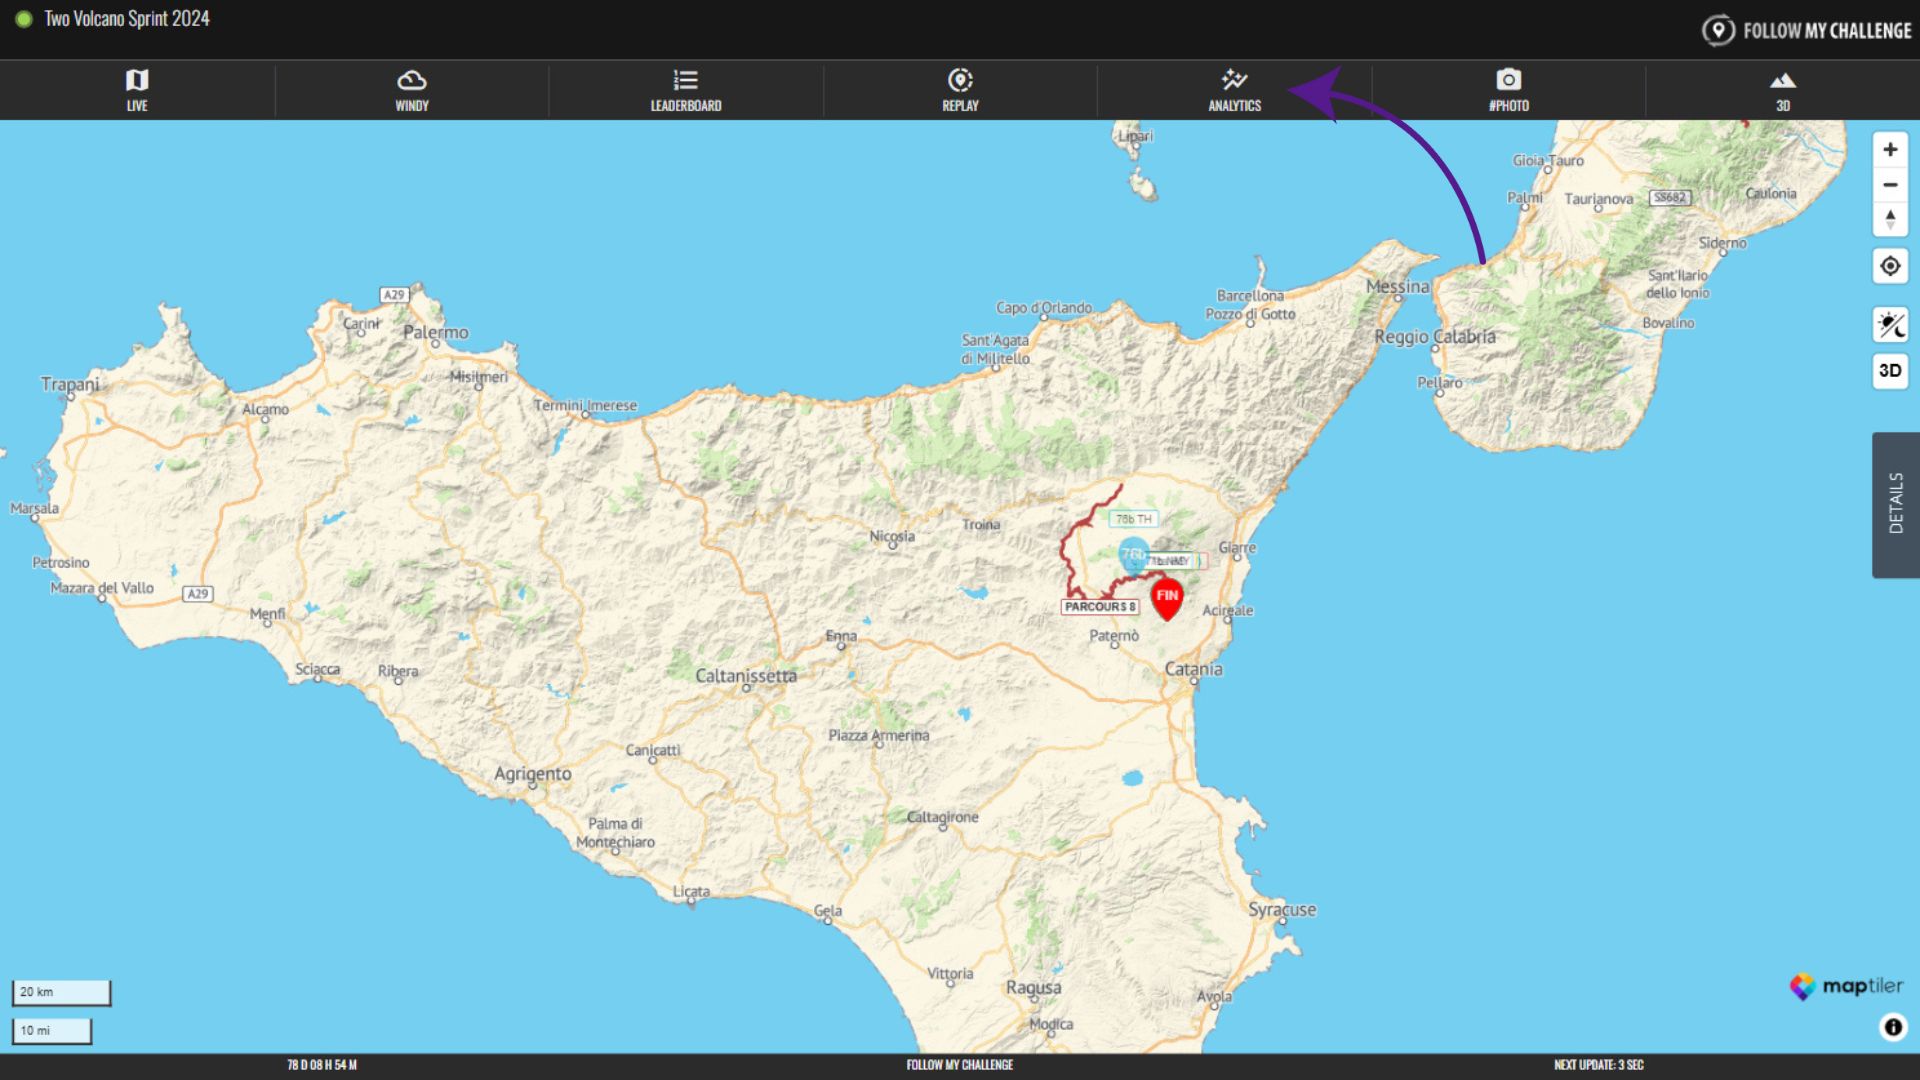
To open the Analytics tab, click the “Analytics” button at the top of the screen. We updated the Analytics tab in early 2026, so maps older than this will appear quite different.
This tab allows for more detailed analysis of the event being tracked, especially participants’ progress or performance. It uses charts, tables and graphs to visualise the data.
Please note that this tab is both data heavy and very detailed. We have optimised it as best as possible to work on mobile, but it is best viewed on larger screens.