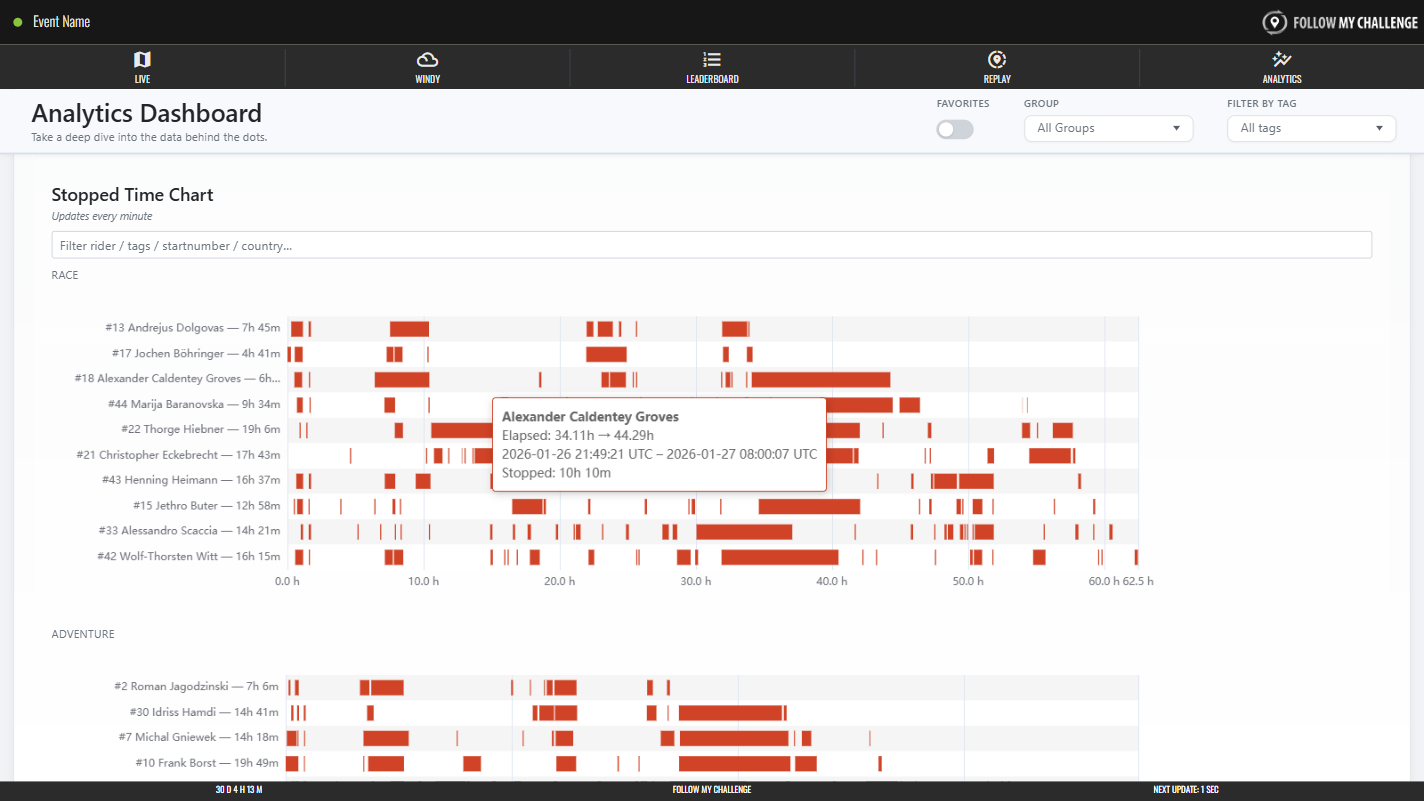
The stopped time section shows time stationary for participants laid over a timeline of the event so far. Any time stopped shows as a solid red bar, with longer stops displayed as longer bars. You can hover/tap a bar to see the exact duration it represents.
Where an event has multiple groups/categories, the chart will be split to display these. You can also filter by name, tags or nationality using the search field above the table.