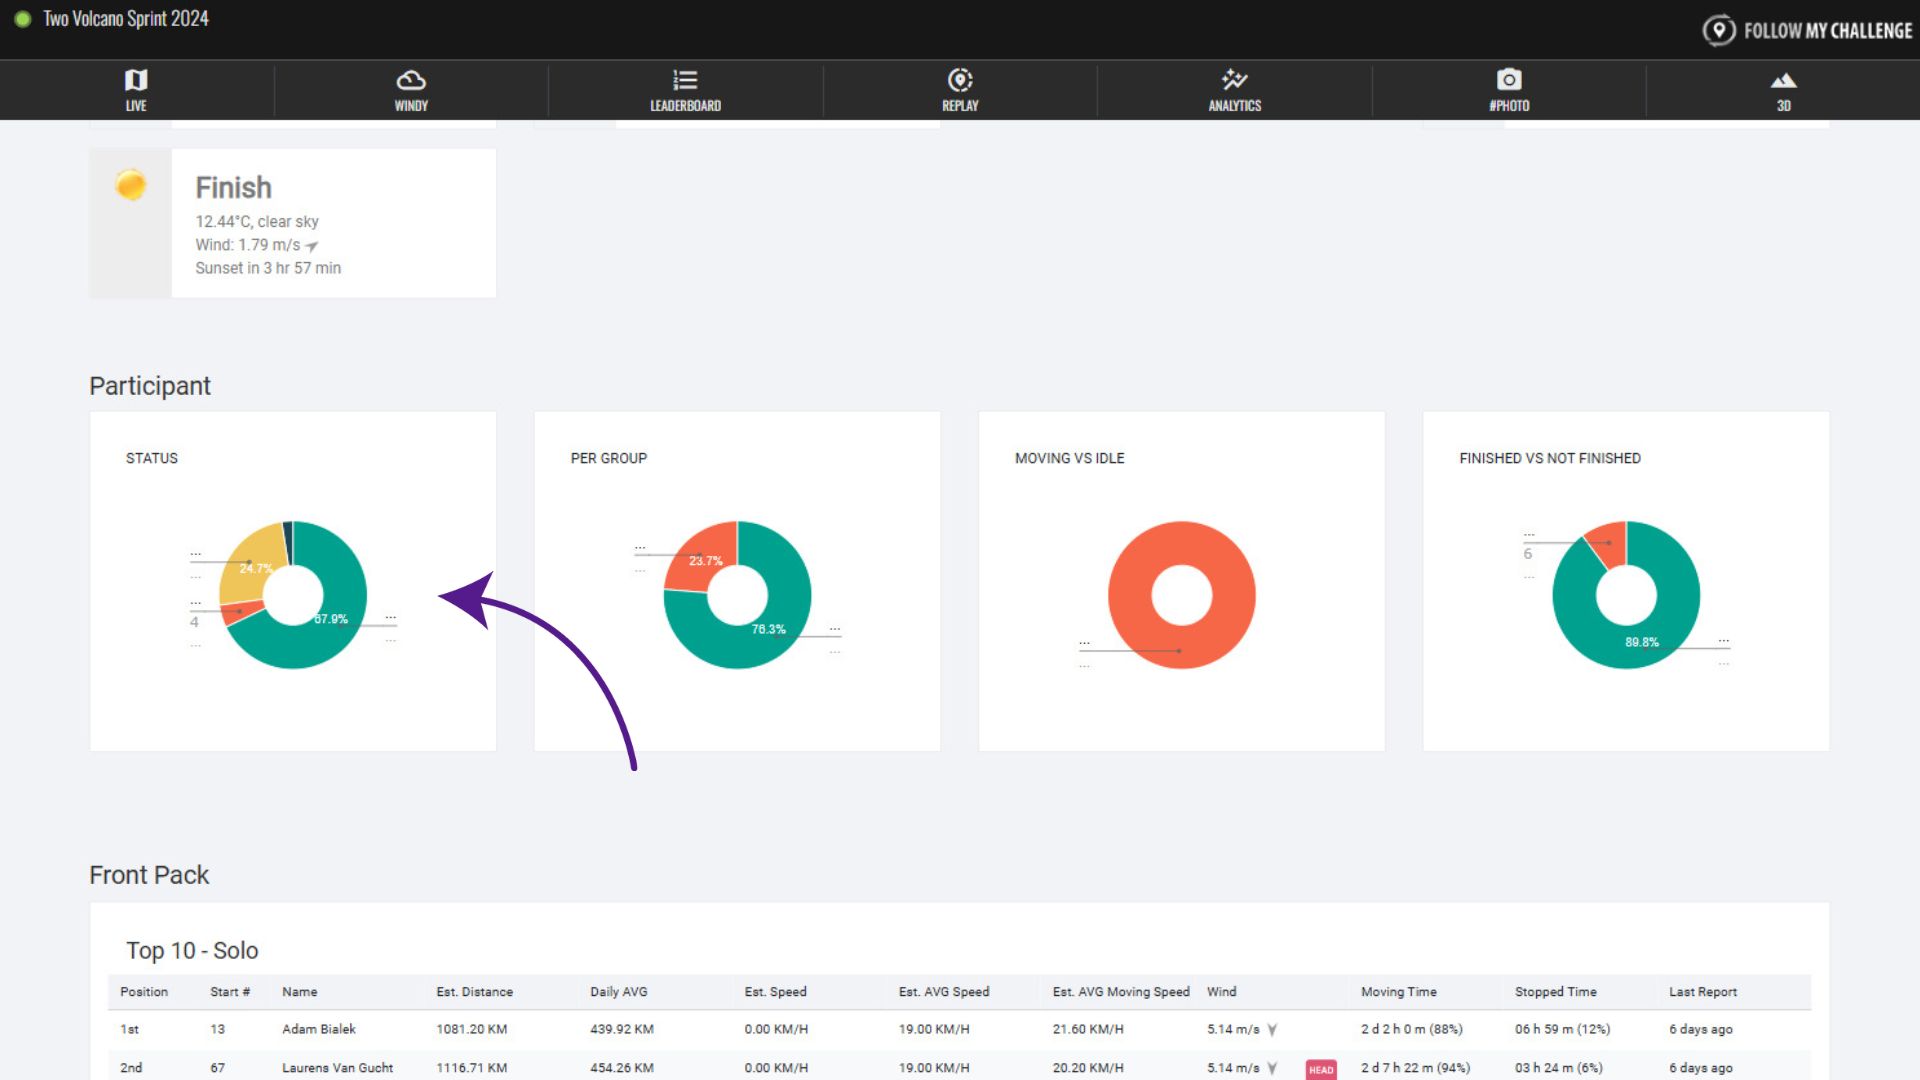
The “Participant” section of the Analytics tab displays a number of charts summarising the make-up of the field currently. The charts show participants’ statuses, different groups, how many participants are still moving and how many have finished. These charts update as the event progresses.